Market Edge
Market Edge
Advanced Analytics on Commodity Data
Real-time Data
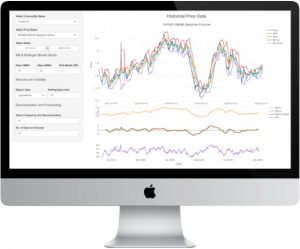
View real-time data, along with historical data of all your prices. Simply connect to the data source that is providing you data, and the solution is ready to provide sophisticated analytics on your data.
Charting and Analysis
MarketEdge gives you the flexibility to create several technical analysis indicators on your chart, on the fly. The analysis module allows users to view historical returns and rolling-window volatility. All technical indicators and analysis are built on user-defined values.
Interactive Visualizations
You can read prices as you hover your cursor on the chart. You can zoom in, zoom out, and even save your charts along with all the analysis as images for your report.
Advanced Analytics
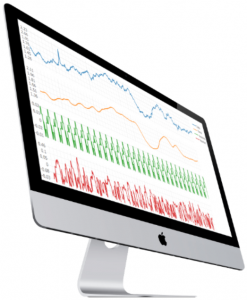
You can decompose any price series into sub-components, and view and analyze the trend and seasonality components of any price series separately. This kind of decomposition also allows users to see the random component of the price movement, and tell them what portion of a large price move was purely random.
Artificial Intelligence (AI) Driven Forecast
The web based solution also allows you to forecast prices till a user-defined period using Machine Learning algorithms, providing you an edge over several other Market players. MarketEdge’s forecasting algorithms is tuned to consider seasonality, missing data points, and trends inherent in any price series, leverage it to understand patterns and use it to predict future prices and trends.

Risk Edge is a leading Solution provider for Machine Learning & Risk Analytics, used by medium and large Energy & Commodity Trading Players.
About us
Reach Out to Us
- +91-90001-17640
- info@riskedgesolutions.com
201, NSIC Business Park, ECIL, Hyderabad, Telangana, India PIN – 500062